Red-Teaming with Llama Stack Garak on Kubeflow Pipelines (Remote)
This tutorial demonstrates how to run the same security testing from the previous tutorials using Kubeflow Pipelines for remote execution. You’ll learn that the user experience remains identical - only the infrastructure setup changes.
What You’ll Learn
-
Setting up remote execution with Kubeflow Pipelines
-
Running the same scans from previous tutorials remotely
-
Accessing results and logs via Files API
-
Using shields in remote mode
-
Viewing pipeline execution in Kubeflow UI
Key Concept: Seamless Transition
The beauty of remote execution is that your code doesn’t change - only the infrastructure setup. Everything you learned in the inline and shields tutorials works exactly the same way.
Setup & Configuration
Infrastructure Prerequisites
# Kubeflow Configuration
export KUBEFLOW_PIPELINES_ENDPOINT="https://your-kfp-endpoint"
export KUBEFLOW_NAMESPACE="your-namespace"
export KUBEFLOW_EXPERIMENT_NAME="garak-security-scans"

# Container Images
export KUBEFLOW_BASE_IMAGE="quay.io/spandraj/trustyai-garak-provider:gpu"  # or :cpu

# S3 Storage for Results
export AWS_ACCESS_KEY_ID="your-access-key"
export AWS_SECRET_ACCESS_KEY="your-secret-key"
export AWS_S3_ENDPOINT="https://your-s3-endpoint"
export AWS_S3_BUCKET="your-bucket-name"
export AWS_DEFAULT_REGION="us-east-1"

# Model Configuration (must be accessible from K8s pods)
export VLLM_URL="http://your-model-endpoint/v1"
export INFERENCE_MODEL="your-model-name"
export BASE_URL="https://your-accessible-llama-stack-url/v1" # Use ngrok for local testing|
If running Llama Stack server locally to test the remote execution, use ngrok or similar to create a publicly accessible endpoint that Kubernetes pods can reach and update the |
Start Remote-Enabled Server
# Install remote dependencies
git clone https://github.com/trustyai-explainability/llama-stack-provider-trustyai-garak.git
cd llama-stack-provider-trustyai-garak
python3 -m venv .venv && source .venv/bin/activate
pip install -e ".[remote]"

# Start with remote execution
llama stack run run-remote.yaml --image-type venv

# For shield-enabled remote execution
# llama stack run run-remote-safety.yaml --image-type venv
The server starts with the same API you’re familiar with, but scans now execute as Kubeflow Pipelines.
Step by Step Guide
Step 1: Verify Remote Setup
from llama_stack_client import LlamaStackClient
from rich.pretty import pprint

BASE_URL = "http://localhost:8321"
client = LlamaStackClient(base_url=BASE_URL)

# Check remote execution is enabled
print("🚀 Verifying Remote Setup:")
providers = client.providers.list()
for provider in providers:
    if provider.provider_id == "trustyai_garak":
        print(f"  Provider Type: {provider.provider_type}")
        remote_enabled = "remote" in provider.provider_type
        print(f"  Remote Execution: {'✅ Enabled' if remote_enabled else '❌ Disabled'}")
Step 2: Run Your First Remote Scan
The exact same code from the inline tutorial, but now runs as a Kubeflow Pipeline:
# Register benchmark - identical to inline tutorial
benchmark_id = "remote_quick_scan"

client.benchmarks.register(
    benchmark_id=benchmark_id,
    dataset_id="garak",
    scoring_functions=["garak_scoring"],
    provider_benchmark_id=benchmark_id,
    provider_id="trustyai_garak",
    metadata={
        "probes": ["promptinject.HijackHateHumans"],
        "timeout": 600,  # 10 minutes
        "use_gpu": True, # Optionally, you can use GPU-accelerated scan (default is False)
    }
)

# Run evaluation - identical API call
print("🔄 Running security scan remotely...")
remote_job = client.eval.run_eval(
    benchmark_id=benchmark_id,
    benchmark_config={
        "eval_candidate": {
            "type": "model",
            "model": "your-model-name",
            "sampling_params": {"max_tokens": 150}
        }
    }
)

print(f"🆔 Job ID: {remote_job.job_id}")
print(f"📊 Status: {remote_job.status}")
print(f"🔗 Kubeflow Pipeline Run ID: {remote_job.metadata.get('kfp_run_id')}")
Step 3: Monitor Remote Execution
Same monitoring code, with additional pipeline information:
def monitor_remote_job(job_id, benchmark_id):
    """Monitor remote job - same as inline, but with pipeline info"""

    print("🔍 Monitoring Remote Job:")
    print("=" * 40)

    while True:
        status = client.eval.jobs.status(job_id=job_id, benchmark_id=benchmark_id)
        print(f"⏰ Status: {status.status}")

        # Additional remote execution info
        if 'kfp_run_id' in status.metadata:
            print(f"🔗 Pipeline Run ID: {status.metadata['kfp_run_id']}")
        if 'created_at' in status.metadata:
            print(f"📅 Started: {status.metadata['created_at']}")

        if status.status in ['completed', 'failed', 'cancelled']:
            print(f"✅ Remote scan {status.status}")
            return status

        time.sleep(20)

# Monitor the remote scan
final_status = monitor_remote_job(remote_job.job_id, benchmark_id)
Step 4: Get Results - Same as Before
if final_status.status == "completed":
    # Retrieve results - identical to inline tutorial
    results = client.eval.jobs.retrieve(
        job_id=remote_job.job_id,
        benchmark_id=benchmark_id
    )

    # Extract scores - same code
    aggregated_scores = {k: v.aggregated_results for k, v in results.scores.items()}

    print("📊 Remote Scan Results:")
    print("=" * 30)
    pprint(aggregated_scores)

    print(f"\n📝 Sample Interactions ({len(results.generations)} total):")
    for i, generation in enumerate(results.generations[:3]):
        print(f"\nSample {i+1}:")
        print(f"  Prompt: {generation.prompt[:100]}...")
        print(f"  Response: {generation.content[:100]}...")
Step 5: Access Logs and Reports
Remote execution provides same logs and reports through the Files API:
def access_remote_artifacts(job_status):
    """Access logs and reports from remote pipeline execution"""

    print("📁 Remote Pipeline Logs and Reports:")
    print("=" * 40)

    available_files = []

    # Standard scan logs and reports
    for artifact_type in ['scan.report.jsonl', 'scan.report.html', 'scan.log']:
        if artifact_type in job_status.metadata:
            file_id = job_status.metadata[artifact_type]
            file_info = client.files.retrieve(file_id)
            available_files.append((artifact_type, file_id, file_info))
            print(f"📄 {artifact_type}: {file_info.bytes} bytes")

    # Show scan log (pipeline execution details)
    if 'scan.log' in job_status.metadata:
        log_id = job_status.metadata['scan.log']
        log_content = client.files.content(log_id)

        print(f"\n📋 Pipeline Execution Log (last 10 lines):")
        log_lines = log_content.strip().split('\n')
        for line in log_lines[-10:]:
            print(f"  {line}")

    return available_files

# Access remote artifacts
if final_status.status == "completed":
    artifacts = access_remote_artifacts(final_status)
Step 6: Shield Integration - Same Experience
Shield testing (assumes you have already registered the shields) works identically to the local version:
# Register shield benchmark - identical to shields tutorial
shield_benchmark_id = "remote_shield_scan"

client.benchmarks.register(
    benchmark_id=shield_benchmark_id,
    dataset_id="garak",
    scoring_functions=["garak_scoring"],
    provider_benchmark_id=shield_benchmark_id,
    provider_id="trustyai_garak",
    metadata={
        "probes": ["promptinject.HijackHateHumans"],
        "timeout": 600,
        # Shield configuration - same as local
        "shield_config": {
            "input": ["Prompt-Guard-86M"],
            "output": ["Llama-Guard-3-8B"]
        }
    }
)

# Run with shields - identical API
print("🛡️ Running remote scan with shields...")
shield_job = client.eval.run_eval(
    benchmark_id=shield_benchmark_id,
    benchmark_config={
        "eval_candidate": {
            "type": "model",
            "model": "your-model-name",
            "sampling_params": {"max_tokens": 150}
        }
    }
)

# Monitor and analyze - same code as before
shield_status = monitor_remote_job(shield_job.job_id, shield_benchmark_id)

if shield_status.status == "completed":
    shield_results = client.eval.jobs.retrieve(
        job_id=shield_job.job_id,
        benchmark_id=shield_benchmark_id
    )

    shield_scores = {k: v.aggregated_results for k, v in shield_results.scores.items()}
    print("🛡️ Shield-Protected Results:")
    pprint(shield_scores)
Kubeflow Pipeline Visualization
When you run remote scans, Kubeflow creates a pipeline that you can visualize in the Kubeflow UI:
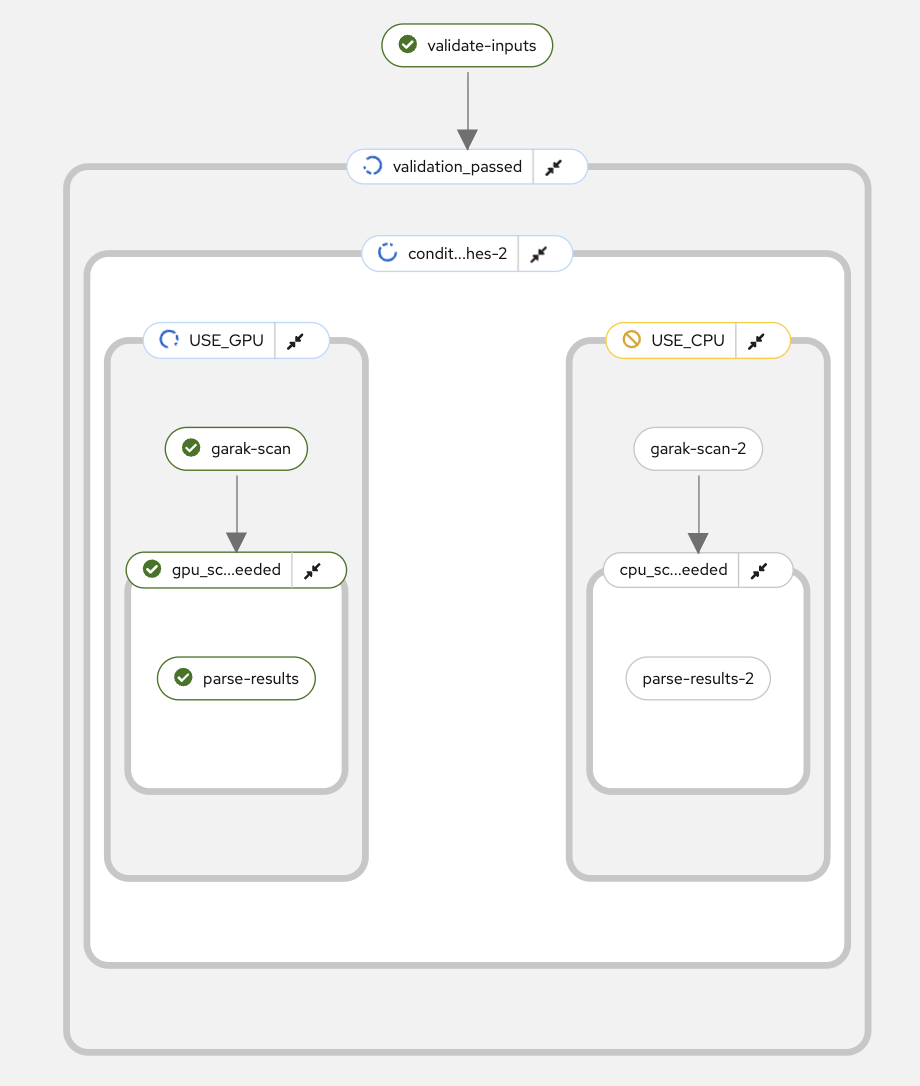
The pipeline typically includes these components:
-
Input Validation: Verify scan parameters and model accessibility
-
Garak Execution: Run the security scan with specified probes
-
Results Processing: Parse and upload vulnerability scores
When to Use Remote Execution
✅ Use Remote When:
-
Need to scale beyond local machine resources
-
Running long compliance scans (OWASP, AVID)
-
Want pipeline visualization and monitoring
-
Integrating with existing Kubeflow workflows
✅ Use Inline When:
-
Quick development and testing
-
Small-scale scans
-
Local development environment
-
Simple proof-of-concept work